The content of this article was originally written by Tae Jin Gu on the Cubrid blog.
该文来源于Cubrid blog(不过源地址已没有相关内容,本文翻译系转载)
When there is an obstacle, or when a Java based Web application is running much slower than expected, we need to use thread dumps. If thread dumps feel like very complicated to you, this article may help you very much. Here I will explain what threads are in Java, their types, how they are created, how to manage them, how you can dump threads from a running application, and finally how you can analyze them and determine the bottleneck or blocking threads. This article is a result of long experience in Java application debugging.
当Java程序遇到了麻烦,或者Java编写的Web应用运行得比预期情况慢,就可以使用thread dumps这一利器分析问题.如果你觉得thread dumps很复杂,那么阅读本文会对你有所帮助.本文将介绍什么是Java线程,线程的种类,如何创建,如何管理,如何对正在运行的程序进行thread dumps,如何分析,最终找到瓶颈或阻塞线程.本文总结了长期调试Java程序的经验.
Java and Thread
java和线程
A web server uses tens to hundreds of threads to process a large number of concurrent users. If two or more threads utilize the same resources, a contention between the threads is inevitable, and sometimes deadlock occurs.
Web服务器通常创建很多线程去处理高并发的用户请求.如果两三个线程使用同样的服务器资源,线程间的竞争就不可避免了,更糟糕的情况下还会发生死锁.
Thread contention is a status in which one thread is waiting for a lock, held by another thread, to be lifted. Different threads frequently access shared resources on a web application. For example, to record a log, the thread trying to record the log must obtain a lock and access the shared resources.
线程竞争是指一个线程等待另一个线程持有的锁.Web服务的不同线程会频繁地访问共享资源,比如记录日志:一个试图记录日志的线程必须先获得锁才能访问共享资源.
Deadlock is a special type of thread contention, in which two or more threads are waiting for the other threads to complete their tasks in order to complete their own tasks.
死锁是线程竞争的一个特殊形式.多个线程都在等待其它线程先于自己完成任务,于是陷入无尽的等待.
Different issues can arise from thread contention. To analyze such issues, you need to use the thread dump. A thread dump will give you the information on the exact status of each thread.
线程竞争会导致很多问题,我们需要使用thread dumps来解决,它会提供每个线程状态的确切信息.
Background Information for Java Threads
Java线程的背景知识
Thread Synchronization
线程同步
A thread can be processed with other threads at the same time. In order to ensure compatibility when multiple threads are trying to use shared resources, one thread at a time should be allowed to access the shared resources by using thread synchronization.
多个线程可以同时运行,为了让使用共享资源的多个线程可以和平共处,同一时刻只允许一个线程访问共享资源,这是通过线程同步来实现的.
Thread synchronization on Java can be done using monitor. Every Java object has a single monitor. The monitor can be owned by only one thread. For a thread to own a monitor that is owned by a different thread, it needs to wait in the wait queue until the other thread releases its monitor.
Java线程同步使用了管程.每个Java对象都有一个管程.每个管程只能被一个线程持有.如果一个线程想持有另一个线程持有的管程,它需要排队等待另一个线程去释放锁.
Thread Status
线程的状态
In order to analyze a thread dump, you need to know the status of threads. The statuses of threads are stated on java.lang.Thread.State.
为了分析thread dump,我们需要知道线程的状态,这些状态用java.lang.Thread.State来表示:
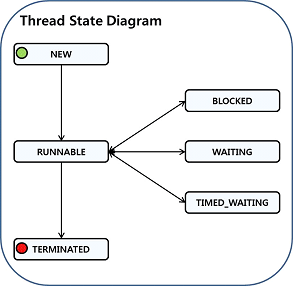
Figure 1: Thread Status.
- NEW: The thread is created but has not been processed yet.
- RUNNABLE: The thread is occupying the CPU and processing a task. (It may be in WAITING status due to the OS’s resource distribution.)
- BLOCKED: The thread is waiting for a different thread to release its lock in order to get the monitor lock.
- WAITING: The thread is waiting by using a wait, join or park method.
TIMED_WAITING: The thread is waiting by using a sleep, wait, join or park method. (The difference from WAITING is that the maximum waiting time is specified by the method parameter, andWAITING can be relieved by time as well as external changes.)
NEW: 线程已经被建立,但是还没有执行.
- RUNNABLE: 线程正使用CPU来处理任务(因为操作系统的资源调度原因,线程可以处于WAITING状态)
- BLOCKED: 线程正在等待另一个线程释放锁.
- WAITING: 线程因为使用了wait, join 或 park 方法而处于等待状态.
- TIMED_WAITING: 线程因为使用了sleep, wait, join 或 park 方法而处于等待状态. (和 WAITING 状态的区别是, 除了外部条件改变之外, 此状态有超时机制, 过了给定的最长等待时间, 此等待状态就解除了)
Thread Types
线程种类
Java threads can be divided into two:
- daemon threads;
- and non-daemon threads.
Java的线程可分为两类:
- 监控线程
- 非监控线程
Daemon threads stop working when there are no other non-daemon threads. Even if you do not create any threads, the Java application will create several threads by default. Most of them are daemon threads, mainly for processing tasks such as garbage collection or JMX.
当没有其它非监控线程继续运行时,监控线程才会停止.即使你没有创建任何线程,Java程序也会创建几个默认线程.默认线程大多是监控线程,主要是为了垃圾回收或者JMX.
A thread running the ‘static void main(String[] args)’ method is created as a non-daemon thread, and when this thread stops working, all other daemon threads will stop as well. (The thread running this main method is called the VM thread in HotSpot VM.)
Java线程同步使用了管程.每个Java对象都有一个管程.每个管程只能被一个线程持有.如果一个线程想持有另一个线程持有的管程,它需要在排队等待另一个线程去释放.执行main方法的线程时非监控线程,当它结束时,所有的监控线程也都要停止.(在HotSpot VM里,这个线程叫做VM Thread).
Getting a Thread Dump
获取Thread Dump
We will introduce the three most commonly used methods. Note that there are many other ways to get a thread dump. A thread dump can only show the thread status at the time of measurement, so in order to see the change in thread status, it is recommended to extract them from 5 to 10 times with 5-second intervals.
有很多种方法可以得到thread dump,我们将介绍最常见的三种方法.一个thread dump只能包含转储时刻的线程状态,所以为了分析线程状态的变化,最好每隔5秒获取一次,得到5~10个thread dump就可以了.
Getting a Thread Dump Using jstack
使用jstack
In JDK 1.6 and higher, it is possible to get a thread dump on MS Windows using jstack.
Use PID via jps to check the PID of the currently running Java application process.
如果JDK版本是1.6或以上,可以在MS Windows上使用jstack.
使用jps来产看系统上正运行的java进程的PID.
1 2 3 4 | |
Use the extracted PID as the parameter of jstack to obtain a thread dump.
把pid作为参数传给jstack,以获取该pid对应java进程的线程转储.
1
| |
A Thread Dump Using jVisualVM
使用jVisualVM
Generate a thread dump by using a program such as jVisualVM.
jVisualVM是JDK提供的可视化工具.
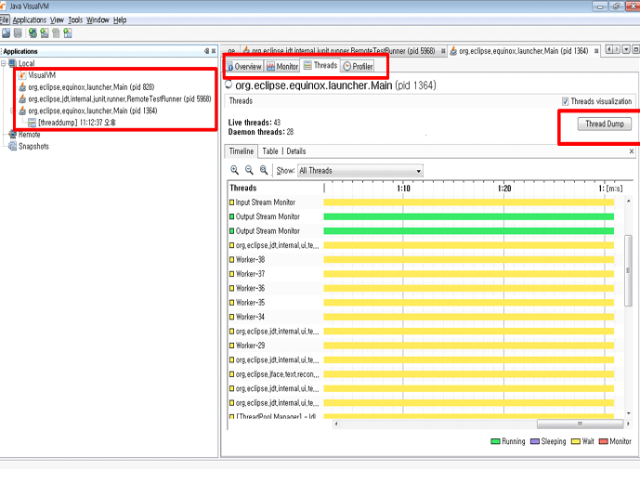
Figure 2: A Thread Dump Using visualvm.
The task on the left indicates the list of currently running processes. Click on the process for which you want the information, and select the thread tab to check the thread information in real time. Click the Thread Dump button on the top right corner to get the thread dump file.
左侧列举了正在运行的java进程.单击想要分析的进程,选择thread选项卡,可以看到实时信息.单击右上角的Thread Dump按钮生成线程转储文件.
Generating in a Linux Terminal
Obtain the process pid by using ps -ef command to check the pid of the currently running Java process.
1 2 3 4 | |
Use the extracted pid as the parameter of kill –SIGQUIT(3) to obtain a thread dump.
Thread Information from the Thread Dump File
线程转储文件包含的线程信息
1 2 3 4 5 6 7 8 9 10 11 12 13 14 15 16 17 | |
- Thread name: When using Java.lang.Thread class to generate a thread, the thread will be named Thread-(Number), whereas when using java.util.concurrent.ThreadFactory class, it will be named pool-(number)-thread-(number).
- Priority: Represents the priority of the threads.
- Thread ID: Represents the unique ID for the threads. (Some useful information, including the CPU usage or memory usage of the thread, can be obtained by using thread ID.)
- Thread status: Represents the status of the threads.
Thread callstack: Represents the call stack information of the threads.
Thread name 线程名: 使用 Java.lang.Thread类去创建线程时,线程的命名方式为Thread-(序号);当使用java.util.concurrent.ThreadFactory类去创建线程时,线程的命名方式为pool-(序号)-thread-(序号).
- Priority 优先级: 表示线程的优先级.
- Thread ID 线程ID: 线程的ID是唯一的(一些有用的信息,比如线程的CPU使用率或者内存使用率,可以通过线程ID找到).
- Thread status 线程状态: 表示线程的状态.
- Thread callstack 线程调用栈: 表示线程的调用栈信息.
Thread Dump Patterns by Type
线程转储的类型布局
When Unable to Obtain a Lock (BLOCKED)
无法获得锁的时候
This is when the overall performance of the application slows down because a thread is occupying the lock and prevents other threads from obtaining it. In the following example, BLOCKED_TEST pool-1-thread-1 thread is running with <0x0000000780a000b0> lock, while BLOCKED_TEST pool-1-thread-2 and BLOCKED_TEST pool-1-thread-3 threads are waiting to obtain <0x0000000780a000b0> lock.
此时整个应用的性能下降了,因为一个线程持有了锁而不肯释放,导致其它线程无法获得锁.在下面的例子里,线程BLOCKED_TEST pool-1-thread-1 获得了锁<0x0000000780a000b0>并且正在运行,此时线程 BLOCKED_TEST pool-1-thread-2 和线程 BLOCKED_TEST pool-1-thread-3 在等待锁<0x0000000780a000b0>.
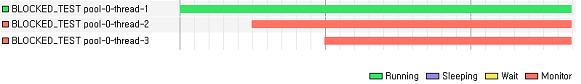
Figure 3: A thread blocking other threads.
1 2 3 4 5 6 7 8 9 10 11 12 13 14 15 16 17 18 19 20 21 22 23 24 25 26 27 28 29 30 31 32 33 34 35 36 37 38 39 40 41 42 43 44 45 46 47 48 49 50 51 | |
When in Deadlock Status
死锁的时候
This is when thread A needs to obtain thread B’s lock to continue its task, while thread B needs to obtain thread A’s lock to continue its task. In the thread dump, you can see that DEADLOCK_TEST-1 thread has 0x00000007d58f5e48 lock, and is trying to obtain 0x00000007d58f5e60 lock. You can also see that DEADLOCK_TEST-2 thread has 0x00000007d58f5e60 lock, and is trying to obtain 0x00000007d58f5e78 lock. Also, DEADLOCK_TEST-3 thread has 0x00000007d58f5e78 lock, and is trying to obtain 0x00000007d58f5e48 lock. As you can see, each thread is waiting to obtain another thread’s lock, and this status will not change until one thread discards its lock.
线程A需要获取线程B的锁,而且B的锁需要获取A的锁.在线程转储文件里,你可以看到 线程DEADLOCK_TEST-1 持有锁0x00000007d58f5e48,并试图获取 锁0x00000007d58f5e60. 你还能看到 线程DEADLOCK_TEST-2 持有 锁0x00000007d58f5e60, 并试图获取 锁0x00000007d58f5e78. 同样, 线程DEADLOCK_TEST-3 持有 锁0x00000007d58f5e78, 并试图获取 锁0x00000007d58f5e48. 和你看到的一样, 每个线程都在等着获取其它线程的锁, 这个状态保持不变, 除非有个线程放弃了它的锁.
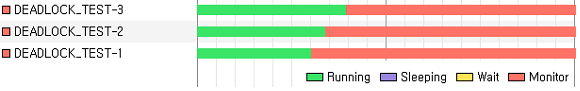
Figure 4: Threads in a Deadlock status.
1 2 3 4 5 6 7 8 9 10 11 12 13 14 15 16 17 18 19 20 21 22 23 24 25 26 27 28 29 30 31 32 | |
When Continuously Waiting to Receive Messages from a Remote Server
持续等待接收远程服务器数据的时候
The thread appears to be normal, since its state keeps showing as RUNNABLE. However, when you align the thread dumps chronologically, you can see that socketReadThread thread is waiting infinitely to read the socket.
因为线程的状态一直是 RUNNABLE ,所以它看起来很正常. 然而, 当你把多个线程转出文件按时间顺序排列, 你可以看到线程 socketReadThread 在无限等待读取socket.

Figure 5: Continuous Waiting Status.
1 2 3 4 5 6 7 8 9 10 11 12 13 14 | |
When Waiting
等待的时候
The thread is maintaining WAIT status. In the thread dump, IoWaitThread thread keeps waiting to receive a message from LinkedBlockingQueue. If there continues to be no message for LinkedBlockingQueue, then the thread status will not change.
线程处于 WAIT 状态. 线程转储文件里, 线程IoWaitThread 一直等待来自 LinkedBlockingQueue 的消息. 如果 LinkedBlockingQueue 没有消息, 那么线程的状态就不会改变.

Figure 6: Waiting status.
1 2 3 4 5 6 7 8 9 10 | |
When Thread Resources Cannot be Organized Normally
线程资源管理失控的时候
Unnecessary threads will pile up when thread resources cannot be organized normally. If this occurs, it is recommended to monitor the thread organization process or check the conditions for thread termination.
如果不能有效地管理线程资源,那么一些不必要的线程就因为没有被销毁而越来越多. 发生这种状况的时候, 应该检查负责线程管理的线程,或者检查线程停止条件.
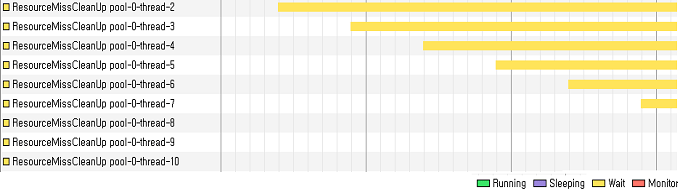
Figure 7: Unorganized Threads.
How to Solve Problems by Using Thread Dump
如何用线程转储解决问题
Example 1: When the CPU Usage is Abnormally High
例 1: CPU使用率过高
Extract the thread that has the highest CPU usage.
找出哪个线程占用了最多的CPU资源.
1 2 3 4 5 | |
From the application, find out which thread is using the CPU the most.
Acquire the Light Weight Process (LWP) that uses the CPU the most and convert its unique number (10039) into a hexadecimal number (0x2737).
找出应用里最占用CPU的那个线程,并获得它的轻量进程 Light Weight Process (LWP). 把这个唯一的LWP数字 (10039) 转成十六进制 (0x2737).
After acquiring the thread dump, check the thread’s action.
得到线程转储文件之后, 检查线程执行的动作.
Extract the thread dump of an application with a PID of 10029, then find the thread with an nid of 0x2737.
把PID为10029的应用进行线程转储, 然后找到nid为 0x2737 的线程.
1 2 3 4 5 6 7 8 9 10 11 12 13 14 15 | |
Extract thread dumps several times every hour, and check the status change of the threads to determine the problem.
按一小时的时间间隔获取多个线程转储文件, 查看线程状态的变化来定位问题.
Example 2: When the Processing Performance is Abnormally Slow
例 2: 应用的效率过低
After acquiring thread dumps several times, find the list of threads with BLOCKED status.
获取多个线程转储文件之后, 找到状态为 BLOCKED 的所有线程.
1 2 3 4 5 6 7 8 9 10 11 12 13 14 15 16 17 18 19 20 21 22 23 | |
Acquire the list of threads with BLOCKED status after getting the thread dumps several times.
If the threads are BLOCKED, extract the threads related to the lock that the threads are trying to obtain.
Through the thread dump, you can confirm that the thread status stays BLOCKED because <0xe0375410> lock could not be obtained. This problem can be solved by analyzing stack trace from the thread currently holding the lock.
There are two reasons why the above pattern frequently appears in applications using DBMS. The first reason is inadequate configurations. Despite the fact that the threads are still working, they cannot show their best performance because the configurations for DBCP and the like are not adequate. If you extract thread dumps multiple times and compare them, you will often see that some of the threads that were BLOCKED previously are in a different state.
The second reason is the abnormal connection. When the connection with DBMS stays abnormal, the threads wait until the time is out. In this case, even after extracting the thread dumps several times and comparing them, you will see that the threads related to DBMS are still in a BLOCKED state. By adequately changing the values, such as the timeout value, you can shorten the time in which the problem occurs.
如果线程处于 BLOCKED 状态, 首先查找阻塞它的锁, 然后把和这个锁有关的线程找出来. 从上面的转储文件里, 你可以看到处于 BLOCKED 状态的线程, 她想获得锁 <0xe0375410>. 这个问题可以通过分析持有锁的线程的调用栈来解决. 使用DBMS的应用会频繁地出现上述问题, 原因有两个. 一是配置不完善. 尽管线程可以运行, 但是类似DBCP等选项没有被正确配置,所以达不到最高的效率. 如果获取多个线程转储文件并比较它们, 你会发现处于 BLOCKED 状态的线程之前是其它状态. 二是连接异常. 如果与DBMS的连接异常, 线程会一直等到超时. 这种情况下, 导出并比较多个转储文件, 你会发现和DBMS有关的线程仍然处于 BLOCKED 状态. 通过多次调整参数, 比如超时时间, 你可以缩短上述问题发生的时间.
Coding for Easy Thread Dump
有利于线程转储的编码方式
Naming Threads
给线程命名
When a thread is created using java.lang.Thread object, the thread will be named Thread-(Number). When a thread is created using java.util.concurrent.DefaultThreadFactory object, the thread will be named pool-(Number)-thread-(Number). When analyzing tens to thousands of threads for an application, if all the threads still have their default names, analyzing them becomes very difficult, because it is difficult to distinguish the threads to be analyzed.
使用java.lang.Thread 创建线程时, 线程被命名为 Thread-(序号). 使用java.util.concurrent.DefaultThreadFactory 创建线程, 线程被命名为 pool-(序号)-thread-(序号). 如果应用有成百上千的线程, 这些线程都使用默认的命名, 分析这些线程就变得困难, 因为区分这些线程不是一件容易的事.
Therefore, you are recommended to develop the habit of naming the threads whenever a new thread is created.
所以,要养成给线程命名的好习惯.
When you create a thread using java.lang.Thread, you can give the thread a custom name by using the creator parameter.
使用 java.lang.Thread时, 通过构造函数给线程一个定制的名字.
1 2 3 4 | |
When you create a thread using java.util.concurrent.ThreadFactory, you can name it by generating your own ThreadFactory. If you do not need special functionalities, then you can use MyThreadFactory as described below:
使用 java.util.concurrent.ThreadFactory时, 可以自己实现一个ThreadFactory. 如果没有特殊的需求, 下面的例子就足够了.
1 2 3 4 5 6 7 8 9 10 11 12 13 14 15 16 17 18 19 20 21 22 23 24 25 26 27 28 29 30 31 32 33 34 35 36 37 38 39 40 41 42 43 44 45 46 | |
Obtaining More Detailed Information by Using MBean
通过MBean获得更详细的信息
You can obtain ThreadInfo objects using MBean. You can also obtain more information that would be difficult to acquire via thread dumps, by using ThreadInfo.
你可以使用MBean获得ThreadInfo对象. 你也可以使用ThreadInfo来获得一些信息, 而线程转储的方式很难获取这些信息.
1 2 3 4 5 6 7 8 9 10 11 | |
You can acquire the amount of time that the threads WAITed or were BLOCKED by using the method in ThreadInfo, and by using this you can also obtain the list of threads that have been inactive for an abnormally long period of time.
你可以方便地得到线程处于 WAIT 和 BLOCKED 状态的时间, 由此你可以获得那些长期处于不活动状态的线程列表.
In Conclusion
结论
In this article I was concerned that for developers with a lot of experience in multi-thread programming, this material may be common knowledge, whereas for less experienced developers, I felt that I was skipping straight to thread dumps, without providing enough background information about the thread activities. This was because of my lack of knowledge, as I was not able to explain the thread activities in a clear yet concise manner. I sincerely hope that this article will prove helpful for many developers.
这篇文章总结了处理多线程的常识性的经验, 对这方面有很多经验的人来说可能帮助不大. 对新人来说, 我感觉我在开门见山地讲线程转储, 而略过了线程活动的背景知识. 这是因为我缺少这方面的经验, 不能简单扼要地进行阐述. 我真诚地希望这篇文章能够帮助更多的人.