What are the benefits of knowing how garbage collection (GC) works in Java? Satisfying the intellectual curiosity as a software engineer would be a valid cause, but also, understanding how GC works can help you write much better Java applications.
This is a very personal and subjective opinion of mine, but I believe that a person well versed in GC tends to be a better Java developer. If you are interested in the GC process, that means you have experience in developing applications of certain size. If you have thought carefully about choosing the right GC algorithm, that means you completely understand the features of the application you have developed. Of course, this may not be common standards for a good developer. However, few would object when I say that understanding GC is a requirement for being a great Java developer.
This is the first of a series of “Become a Java GC Expert” articles. I will cover the GC introduction this time, and in the next article, I will talk about analyzing GC status and GC tuning examples from NHN.
The purpose of this article is to introduce GC to you in an easy way. I hope this article proves to be very helpful. Actually, my colleagues have already published a few great articles on Java Internals which became quite popular on Twitter. You may refer to them as well.
Returning back to Garbage Collection, there is a term that you should know before learning about GC. The term is “stop-the-world.” Stop-the-world will occur no matter which GC algorithm you choose. Stop-the-world means that the JVM is stopping the application from running to execute a GC. When stop-the-world occurs, every thread except for the threads needed for the GC will stop their tasks. The interrupted tasks will resume only after the GC task has completed. GC tuning often means reducing this stop-the-world time.
Generational Garbage Collection
Java does not explicitly specify a memory and remove it in the program code. Some people sets the relevant object to null or use System.gc() method to remove the memory explicitly. Setting it to null is not a big deal, but calling System.gc() method will affect the system performance drastically, and must not be carried out. (Thankfully, I have not yet seen any developer in NHN calling this method.)
In Java, as the developer does not explicitly remove the memory in the program code, the garbage collector finds the unnecessary (garbage) objects and removes them. This garbage collector was created based on the following two hypotheses. (It is more correct to call them suppositions or preconditions, rather than hypotheses.)
- Most objects soon become unreachable.
- References from old objects to young objects only exist in small numbers.
These hypotheses are called the weak generational hypothesis. So in order to preserve the strengths of this hypothesis, it is physically divided into two - young generation and old generation - in HotSpot VM.
Young generation: Most of the newly created objects are located here. Since most objects soon become unreachable, many objects are created in the young generation, then disappear. When objects disappear from this area, we say a “minor GC” has occurred.
Old generation: The objects that did not become unreachable and survived from the young generation are copied here. It is generally larger than the young generation. As it is bigger in size, the GC occurs less frequently than in the young generation. When objects disappear from the old generation, we say a “major GC” (or a “full GC”) has occurred.
Let’s look at this in a chart.
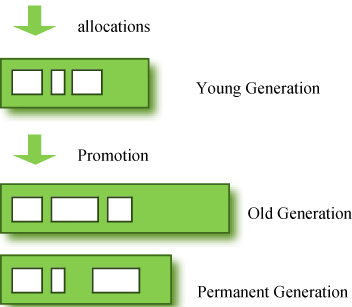
The permanent generation from the chart above is also called the “method area,” and it stores classes or interned character strings. So, this area is definitely not for objects that survived from the old generation to stay permanently. A GC may occur in this area. The GC that took place here is still counted as a major GC.
Some people may wonder:
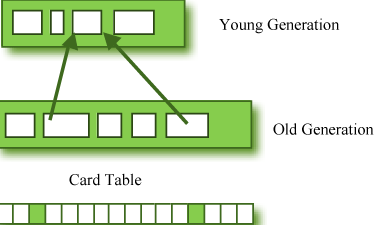
What if an object in the old generation need to reference an object in the young generation?
To handle these cases, there is something called the a “card table” in the old generation, which is a 512 byte chunk. Whenever an object in the old generation references an object in the young generation, it is recorded in this table. When a GC is executed for the young generation, only this card table is searched to determine whether or not it is subject for GC, instead of checking the reference of all the objects in the old generation. This card table is managed with write barrier. This write barrier is a device that allows a faster performance for minor GC. Though a bit of overhead occurs because of this, the overall GC time is reduced.
Composition of the Young Generation
In order to understand GC, let’s learn about the young generation, where the objects are created for the first time. The young generation is divided into 3 spaces.
- One Eden space
- Two Survivor spaces
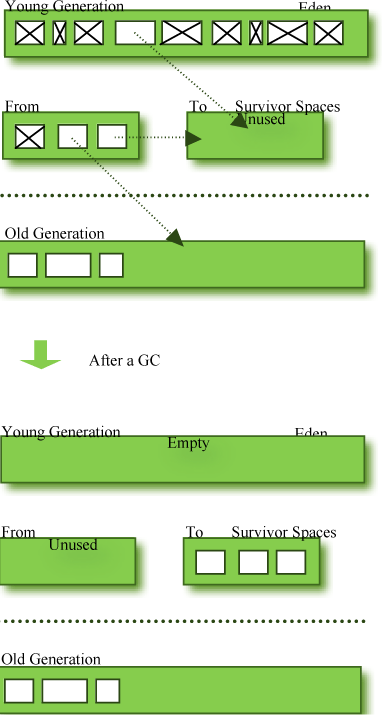
There are 3 spaces in total, two of which are Survivor spaces. The order of execution process of each space is as below:
- The majority of newly created objects are located in the Eden space.
- After one GC in the Eden space, the surviving objects are moved to one of the Survivor spaces.
- After a GC in the Eden space, the objects are piled up into the Survivor space, where other surviving objects already exist.
- Once a Survivor space is full, surviving objects are moved to the other Survivor space. Then, the Survivor space that is full will be changed to a state where there is no data at all.
- The objects that survived these steps that have been repeated a number of times are moved to the old generation.
As you can see by checking these steps, one of the Survivor spaces must remain empty. If data exists in both Survivor spaces, or the usage is 0 for both spaces, then take that as a sign that something is wrong with your system.
The process of data piling up into the old generation through minor GCs can be shown as in the below chart:
Note that in HotSpot VM, two techniques are used for faster memory allocations. One is called “bump-the-pointer,” and the other is called “TLABs (Thread-Local Allocation Buffers).”
Bump-the-pointer technique tracks the last object allocated to the Eden space. That object will be located on top of the Eden space. And if there is an object created afterwards, it checks only if the size of the object is suitable for the Eden space. If the said object seems right, it will be placed in the Eden space, and the new object goes on top. So, when new objects are created, only the lastly added object needs to be checked, which allows much faster memory allocations. However, it is a different story if we consider a multithreaded environment. To save objects used by multiple threads in the Eden space for Thread-Safe, an inevitable lock will occur and the performance will drop due to the lock-contention. TLABs is the solution to this problem in HotSpot VM. This allows each thread to have a small portion of its Eden space that corresponds to its own share. As each thread can only access to their own TLAB, even the bump-the-pointer technique will allow memory allocations without a lock.
This has been a quick overview of the GC in the young generation. You do not necessarily have to remember the two techniques that I have just mentioned. You will not go to jail for not knowing them. But please remember that after the objects are first created in the Eden space, and the long-surviving objects are moved to the old generation through the Survivor space.
GC for the Old Generation
The old generation basically performs a GC when the data is full. The execution procedure varies by the GC type, so it would be easier to understand if you know different types of GC.
According to JDK 7, there are 5 GC types.
- Serial GC
- Parallel GC
- Parallel Old GC (Parallel Compacting GC)
- Concurrent Mark & Sweep GC (or “CMS”)
- Garbage First (G1) GC
Among these, the serial GC must not be used on an operating server. This GC type was created when there was only one CPU core on desktop computers. Using this serial GC will drop the application performance significantly.
Now let’s learn about each GC type.
Serial GC (-XX:+UseSerialGC)
The GC in the young generation uses the type we explained in the previous paragraph. The GC in the old generation uses an algorithm called “mark-sweep-compact.”
- The first step of this algorithm is to mark the surviving objects in the old generation.
- Then, it checks the heap from the front and leaves only the surviving ones behind (sweep).
- In the last step, it fills up the heap from the front with the objects so that the objects are piled up consecutively, and divides the heap into two parts: one with objects and one without objects (compact).
The serial GC is suitable for a small memory and a small number of CPU cores.
Parallel GC (-XX:+UseParallelGC)

From the picture, you can easily see the difference between the serial GC and parallel GC. While the serial GC uses only one thread to process a GC, the parallel GC uses several threads to process a GC, and therefore, faster. This GC is useful when there is enough memory and a large number of cores. It is also called the “throughput GC.”
Parallel Old GC(-XX:+UseParallelOldGC)
Parallel Old GC was supported since JDK 5 update. Compared to the parallel GC, the only difference is the GC algorithm for the old generation. It goes through three steps: mark – summary – compaction. The summary step identifies the surviving objects separately for the areas that the GC have previously performed, and thus different from the sweep step of the mark-sweep-compact algorithm. It goes through a little more complicated steps.
CMS GC (-XX:+UseConcMarkSweepGC)
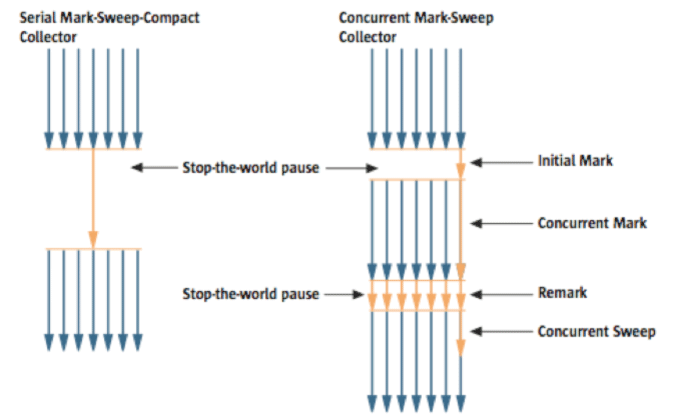
As you can see from the picture, the Concurrent Mark-Sweep GC is much more complicated than any other GC types that I have explained so far. The early initial mark step is simple. The surviving objects among the objects the closest to the classloader are searched. So, the pausing time is very short. In the concurrent mark step, the objects referenced by the surviving objects that have just been confirmed are tracked and checked. The difference of this step is that it proceeds while other threads are processed at the same time. In the remark step, the objects that were newly added or stopped being referenced in the concurrent mark step are checked. Lastly, in the concurrent sweep step, the garbage collection procedure takes place. The garbage collection is carried out while other threads are still being processed. Since this GC type is performed in this manner, the pausing time for GC is very short. The CMS GC is also called the low latency GC, and is used when the response time from all applications is crucial.
While this GC type has the advantage of short stop-the-world time, it also has the following disadvantages.
- It uses more memory and CPU than other GC types.
- The compaction step is not provided by default.
You need to carefully review before using this type. Also, if the compaction task needs to be carried out because of the many memory fragments, the stop-the-world time can be longer than any other GC types. You need to check how often and how long the compaction task is carried out.
G1 GC
Finally, let’s learn about the garbage first (G1) GC.
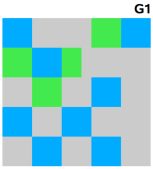
If you want to understand G1 GC, forget everything you know about the young generation and the old generation. As you can see in the picture, one object is allocated to each grid, and then a GC is executed. Then, once one area is full, the objects are allocated to another area, and then a GC is executed. The steps where the data moves from the three spaces of the young generation to the old generation cannot be found in this GC type. This type was created to replace the CMS GC, which has causes a lot of issues and complaints in the long term.
The biggest advantage of the G1 GC is its performance. It is faster than any other GC types that we have discussed so far. But in JDK 6, this is called an early access and can be used only for a test. It is officially included in JDK 7. In my personal opinion, we need to go through a long test period (at least 1 year) before NHN can use JDK7 in actual services, so you probably should wait a while. Also, I heard a few times that a JVM crash occurred after applying the G1 in JDK 6. Please wait until it is more stable.
I will talk about the GC tuning in the next issue, but I would like to ask you one thing in advance. If the size and the type of all objects created in the application are identical, all the GC options for WAS used in our company can be the same. But the size and the lifespan of the objects created by WAS vary depending on the service, and the type of equipment varies as well. In other words, just because a certain service uses the GC option “A,” it does not mean that the same option will bring the best results for a different service. It is necessary to find the best values for the WAS threads, WAS instances for each equipment and each GC option by constant tuning and monitoring. This did not come from my personal experience, but from the discussion of the engineers making Oracle JVM for JavaOne 2010.
In this issue, we have only glanced at the GC for Java. Please look forward to our next issue, where I will talk about how to monitor the Java GC status and tune GC.
I would like to note that I referred to a new book released in December 2011 called “Java Performance” (Amazon, it can also be viewed from safari online, if the company provides an account), as well as “Memory Management in the Java HotSpotTM Virtual Machine,” a white paper provided by the Oracle website. (The book is different from “Java Performance Tuning.”)
By Sangmin Lee, Senior Engineer at Performance Engineering Lab, NHN Corporation.